 John E. Chapman Chief Executive Officer
Introduction
The “paradox of high expectations” is a phrase used to describe a phenomenon in financial markets where high investor expectations for growth and corporate profitability impose a challenging scenario for investors navigating the deployment of capital into equities. In an environment of high expectations, stock prices have often already soared to elevated levels, and major market indices continually close at record levels.
Stock prices are not merely a reflection of current economic performance; they also incorporate investors’ expectations for future earnings and market performance. Similarly, when certain companies are expected to grow rapidly or disrupt entire industries, expectations can drive stock prices significantly higher than the fundamentals might justify.
Investor optimism and bull market momentum are powerful forces in financial markets. Price gains tend to boost further gains in a self-reinforcing feedback loop. Markets can rise higher and over longer periods of time than many investors believe is warranted. Waiting for a pullback can mean missing out on the powerful upswings that occur unpredictably. In turn, waiting can lead to meaningfully lower returns compared to simply investing and staying in the market.
There is no perfect moment to invest in equities, or at least we can never be sure of one until well after the fact. Waiting for the exact “low” to enter the market risks missing out on gains if equity prices continue to march higher. Markets are inherently impossible to predict and rarely offer clear signals before moving sharply up or down.
While elevated valuations can signal optimism over future growth, they can also make the market more sensitive to any disappointments, leading to increased volatility. If company earnings or macroeconomic conditions fail to meet the priced-in expectations, the probability of abrupt price swings or corrections rises, sometimes significantly. Confidence can quickly turn to fear. The transition from optimism to pessimism is often more abrupt when markets are expensive.
A strong empirical case can be made that long-term investors will likely enjoy positive returns over time when they have invested lump sums, even at record-high levels. This said, major drawdowns soon after investing can permanently impair portfolio growth, especially for those withdrawing funds (such as retirees). A sharp decline at the outset can devastate portfolio sustainability and magnify sequence-of-returns risk.
Accordingly, investors face a difficult dilemma when it comes to knowing when to commit capital to the equity markets in periods of high valuations and record prices. Unfortunately, there are no perfect answers to this predicament. The challenge is multifaceted and involves a careful understanding of historical data and the delicate application of personal priorities.
This report attempts to evaluate the trade-offs between investing immediately versus waiting for cheaper entry points. Our analysis draws on 1995-2025 market history, valuation/return statistics, and the behavioral realities that shape outcomes.
Valuations: A Long-Term Evidence-Based Analysis
Over the past three decades, the S&P 500’s price-to-earnings ratio (P/E) has ranged from single digits (panic lows) to nearly 50 (dot-com extremes). The standard P/E ratio uses the most recent year’s earnings or forward estimates, both of which can be quite volatile due to business cycles, short-term shocks, or temporary disruptions. The table below illustrates that both the trailing and forward P/E ratios are currently quite elevated, at the 83rd percentile and 77th percentile, respectively (Seeking Alpha).
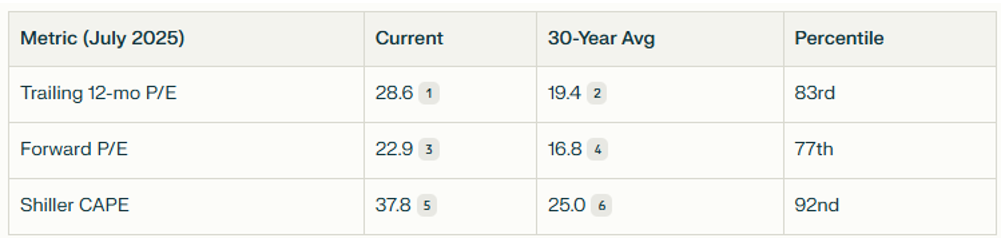
Based on 30 years of market data, starting from a trailing 12-month P/E of 28.6 and a forward P/E of 22.9, the S&P 500’s expected forward returns are significantly below historical averages. The analysis indicates 5-year annualized returns of approximately 2-3% and 10-year annualized returns of approximately 3-4%, compared to the long-term historical average of 10% (Apollo Global).
Research shows that the CAPE (Cyclically Adjusted Price-to-Earnings) ratio has historically had even greater predictive power for long-term stock market returns compared to simple P/E ratios. The CAPE ratio uses an average of inflation-adjusted earnings over the previous 10 years, which smooths out short-term fluctuations and provides a more stable indicator of long-term value.
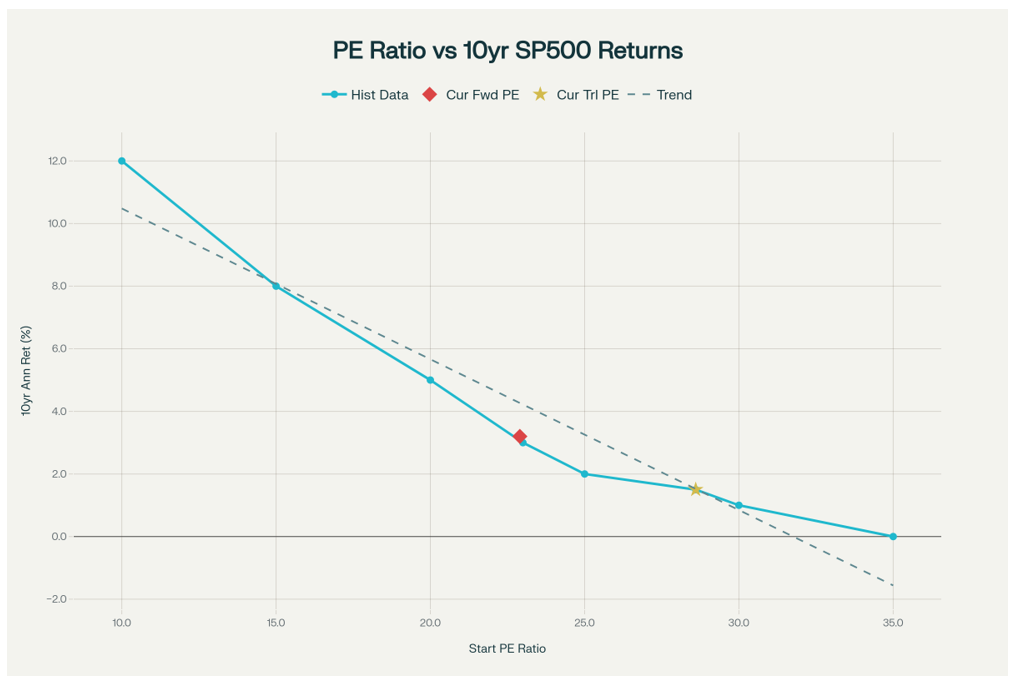
The graph above compares the 10-year expected forward returns for starting P/E levels to starting CAPE levels. Historically, it is clear that higher starting valuations have resulted in lower forward returns, while lower CAPE starting levels have occurred ahead of stronger market performance.
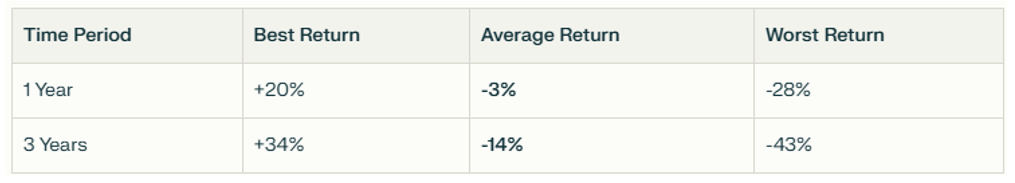
The current Shiller CAPE ratio for the U.S. stock market is approximately 38.8, as of the end of July 2025. A CAPE ratio of 38.8 places the market in extreme valuation territory that has been reached only a handful of times in the past 144 years. There have only been 35 instances since 1957 where monthly CAPE exceeded 37. The table below shows the best, average, and worst forward 1-year and 3-year returns for these 35 occasions (Visual Capitalist).
A CAPE ratio of 38.8 represents the 4th highest valuation in S&P 500 history, exceeded only during the 1999-2000 tech bubble peak. Based on 30 years of market data and multiple analytical methodologies, this extreme valuation level implies 5-year annualized returns of approximately 1.0% and 10-year annualized returns of approximately 2.0%. These expectations represent a significant underperformance of 5-7 percentage points below historical averages (Visual Capitalist).
Record Highs: A Long-Term Evidence-Based Analysis
The U.S. equity market rises in about three out of every four years and spends approximately 7% of trading days at all-time highs. Since 1950, the S&P 500 has ended any given month at an all-time high only 26% of the time (Barclays). This said, waiting for a pullback to commit capital to equities can mean staying on the sidelines for longer periods of time than one might expect and missing continued growth as the markets continue to trend higher.
From this perspective, investing a lump sum right away can produce better long-term returns when compared to waiting for a market pullback. This is because the longer an investor waits to invest, the more “opportunity cost” they may incur, as uninvested cash typically earns less than stocks over time.
The compelling urge to wait for a market pullback before deploying a lump sum into equities is understandable, especially when stocks are at record levels. Still, the evidence suggests this could be a mistake. While intuitive, the “wait for a dip” strategy has proven exceedingly difficult to pull off because when corrections do not materialize, the cost of waiting has the potential of exceeding possible benefits from successfully timing the market.
Consider the period from February 2013 through September 2017, when respected market strategist Jeremy Grantham warned that markets were “brutally overpriced” with the CAPE ratio climbing from 22 to 24.6. Despite these accurate valuation concerns, the S&P 500 delivered 14.2% annualized returns during this period, totaling 85.6% in cumulative returns. Investors who waited for the anticipated correction missed this entire rally (YCharts).
Market returns occur in highly concentrated, unpredictable bursts that can make timing strategies particularly difficult, even impossible. Consider the following data points (Cogent Strategic Wealth):
- 5% of months (roughly one per year) provided nearly 100% of all returns from 1927-2016
- The best-performing 91 months averaged 10.5% returns each
- The remaining 1,001 months averaged virtually zero return (0.1%)
- Missing just the best 10 months over 40 years, reduced returns by 27%
- Missing the best 40 months (only 8% of the period) reduced returns by 76%
This concentration means that being out of the market for even brief periods can devastate long-term returns, making successful market timing problematic. The late 1990s saw CAPE ratios exceed 30 for several years before the eventual correction (Multpl.com). Investors who waited during this period missed substantial gains, even accounting for the subsequent bear market.
Historical analysis shows that investments made at all-time highs have performed slightly better than average over one, three, and five-year periods (StockAnalysis.com). It is important to recognize that this is a study of “averages”. This perspective does not reflect the forward returns for unlucky investors who commit lump sums at record highs occurring late in a bull market cycle.
Those who committed lump sums of capital to stocks at the Dot-Com bubble peak (March 2000) had to wait roughly 7 years to break even. Investors who likewise invested at the market peak in October 2007, just ahead of the Great Recession, waited approximately 5.5 years to recover their losses (Brighton Jones). Both moments in time exhibited bullishness and high expectations.
History’s most extreme example of “bad luck” goes to investors who invested in Japanese equities at the Nikkei’s peak of 38,915 on December 29, 1989. These investors endured 34 years before seeing new highs in 2024 (Reuters).
This said, one cannot ignore the historical evidence indicating that errors in timing during periods of extreme market reversals are often less catastrophic than commonly perceived. This is generally because subsequent recovery in the market is the norm. Investors with time horizons longer than five years have historically been rewarded for staying invested, even after purchasing at peaks. Apart from the 1929 Great Depression, all major U.S. market peaks have recovered within a decade. Although for many investors, a decade would be an intolerably long period to wait.
Overall, the historical analysis of investing at record highs suggests that the most successful approach remains maintaining appropriate asset allocation, investing consistently over time, and avoiding the futile pursuit of perfect market timing. While buying at peaks may not be optimal, this perspective argues that the greater risk lies not in imperfect timing but in allowing timing to prevent long-term wealth building through equity market participation.
Dollar Cost Averaging – A Tactical Alternative
Dollar cost averaging involves investing a fixed dollar amount in the same investment at regular intervals, regardless of the asset’s price. The strategy operates on a simple principle: when prices are low, your fixed investment amount buys more shares; when prices are high, it buys fewer shares. Over time, this can result in a lower average cost per share compared to investing all at once at an inopportune moment.
The automatic nature of dollar cost averaging also promotes disciplined investing habits. By committing to regular investments regardless of market conditions, investors avoid the paralysis that often accompanies volatile markets.
Rather than investing a lump sum of money all at once when markets are trading at historically high valuations, the dollar-cost averaging approach can significantly reduce recovery periods compared to ill-timed lump sum commitments. Analysis of the 2008 financial crisis shows that investors using dollar-cost averaging shortened their recovery time by over one full year compared to lump-sum peak investing (FA.com).
Historical analysis shows that investors who started dollar cost averaging their investments just before bear markets often outperformed lump sum investors due to their ability to purchase additional shares at discounted prices. Conversely, dollar cost averaging underperforms the lump sum approach in rising markets as investors repeatedly make new stock purchases at higher prices.
In other words, dollar cost averaging is a winning strategy in markets trending lower, but a losing strategy in markets trending higher.
Behavioral Dimension
Investment outcomes are highly predicated on investor behavior. Research stemming from the field of Behavioral Finance has established that most investors experience the pain of a meaningful loss twice as much as the satisfaction of an equivalent gain.
Importantly, for the lump sum commitment (at high valuations scenario) to be effective, an investor must remain committed to the strategy, should the event of a pullback occur. This may be easier said than done. Vanguard finds that 23% of lump-sum investors panic-sell in the first big correction.
The tendency to panic sell when markets drop is rooted in trying to avoid further losses. Still, it often results in selling at the worst possible time, making the damage permanent, and missing the recovery. As Mike Tyson famously said, “Everyone has a plan until they get punched in the face.”
Regret aversion and psychological biases can also trap investors in cash. Research demonstrates that investors who wait for “perfect” entry points frequently never invest, as markets can remain elevated for extended periods. This psychological paralysis often proves more costly than any short-term volatility that might occur following a lump sum investment.
The S&P 500 experiences a 5% pullback approximately three times per year and a 10% correction roughly once per year. However, distinguishing between a temporary dip and the beginning of a meaningful correction is nearly impossible in real-time. Even professional fund managers miscalled all nine major turning points over a 19-year period, according to Goldman Sachs research.
Lastly, behavioral mistakes can multiply if markets continue rising while an investor is waiting for a correction to reach their original target price. For example, if an investor is waiting for a 10% correction when the market is at 4,500, but it rises to 5,000, they would then need a 20% correction to reach the same entry point. This creates a psychological trap where investors either chase higher markets or wait for increasingly unlikely large corrections.
Confused Yet?
The seemingly contradictory findings regarding lump sum investments during high valuation periods versus waiting for market pullbacks pose one of the most complex challenges in modern investment analysis. This paradox reflects the fundamental difference between long-term valuation metrics and market timing strategies, creating confusion among investors trying to reconcile these competing perspectives.
The CAPE ratio, developed by Nobel laureate Robert Shiller, has demonstrated remarkable predictive power for long-term returns. Research shows that the correlation between starting CAPE values and forward 10-year real stock returns reaches -0.9476, meaning that 90% of the variation in future returns can be statistically explained by the starting CAPE level. This powerful negative correlation makes CAPE one of the most reliable predictors of long-term market performance (CFA Institute).
Conversely, extensive research on lump sum investing presents compelling evidence that delaying the lump sum commitment of capital to equities in favor of waiting for a pullback is nearly impossible to execute. Earlier investment allows for longer compounding periods and supports the idea that time in the market is more important than timing the market.
Our analysis suggests both schools of thought can be simultaneously correct. How is that possible? It is possible because the two perspectives operate on different time horizons and assumptions. In other words, we observe seemingly contradictory answers because we are inherently asking two fundamentally different questions.
- If an investor has a lump sum of cash to invest today, are they better served investing it immediately, over time, or after waiting for a more attractive entry point?
- Given current valuation levels, what forward returns might investors expect over the next 3, 5, and 10 years based on historical observations?
As with many difficult challenges, we see that two distinctly opposite perspectives can both be true at the same time. The research favoring lump sum commitment to equities is factually relevant despite record market highs. However, high CAPE ratios factually point to increased probabilities for negative returns over short time horizons and the potential for impaired forward returns.
Resolving the Paradox with “It Depends”
The answer to the dilemma presented in this paper rests in gaining clarity on several investor-specific factors. In other words, what is the investor solving for? The “best” choice for any given investor rests in their priorities and preferences. Such factors would include:
- Time Horizon Clarity
- Risk Mitigation Preferences
- Current Asset Allocation Structure
- Forward Return Expectations
- Inclination For Complexity / Simplicity
Investors who have long planning horizons, high tolerance for market volatility, well-diversified existing investments, targeted return expectations at (or slightly below) long-term average returns, and a preference for simplicity may favor the lump sum approach, hoping they are not “jumping the gun” with their commitment of capital.
Investors with shorter planning horizons, low tolerance for market volatility, little or no existing investment diversification, high expectations for above average returns (along with low FOMO, fear of missing out), and a preference for establishing complex timing protocols, may favor the “wait and see” approach, hoping for a materially better entry point to commit capital.
Investors with some unique blend of these factors might possibly select a predetermined combination of cash deployment methods (such as dollar cost averaging) that aligns their desire for discipline with their top priorities, hoping for a blended result.
CONCLUSION
Investors struggle with the psychological challenge of investing large sums when valuations appear stretched, understandably so. Waiting for a more attractive entry point can provide emotional comfort during high-valuation periods, even if it can be shown to be mathematically suboptimal. Conversely, pressing forward with lump sum investments at high valuation levels has the potential to trigger regret, should some unfavorable catalyst develop and the prevailing optimism dissolve rapidly into fear.
Market corrections following new highs are exceedingly difficult to predict and can be incredibly painful. Often, these reversals begin with frightening headlines, causing investors to reassess their expectations. Even when the correction occurs, investors can become paralyzed with new fears. Thus, the opportunity cost of waiting can compound rapidly, often exceeding any downside protection that might have been gained by waiting.
Still, valuations are undeniably a strong indicator of long-term equity forward returns. Investing in periods of high valuation exposes investors to greater risk of large corrections, potentially inferior long-term returns, and emotional pressures from volatility. These scenarios are especially problematic for those with limited time horizons or low risk tolerance. The evidence here supports why many professional investors exercise greater caution when valuations are high.
Although the data in this report may seem meaningful to an investor favoring one perspective over the other, it remains inconclusive on the matter. It should be expected that different investors looking at the same data might come to opposite conclusions regarding which method is best. This does not suggest the data is wrong, nor does it say the analysis is flawed.
Perhaps the paradox is best answered with the following understanding: 1) an ideal, well-timed point of entry always wins, 2) pulling off an ideal, well-timed point of entry is nearly impossible to do, and 3) investors who choose to invest at market peaks will likely see gains over longer periods of time, provided they stick with their plan even if the market eventually tells them “they should have waited”.
Just as there is no perfect moment to invest in equities, there is no proven methodology that perfectly resolves the challenge of investing lump sums when the equity markets are arguably expensive. Deciding whether to invest or postpone committing funds to equities when the market is at high valuation levels or reaching record closings is one of the most challenging decisions investors encounter.
Sources:
- https://www.stockmarketperatio.com
- https://www.valuescopeinc.com/resources/white-papers/the-sp-500-pe-ratio-a-historical-perspective
- https://en.macromicro.me/series/20052/sp500-forward-pe-ratio
- https://en.macromicro.me/charts/88416/US-S-P-500-Forward-PE-Ratio-plus-MA
- https://ycharts.com/indicators/cyclically_adjusted_pe_ratio
- https://www.gurufocus.com/economic_indicators/56/sp-500-shiller-cape-ratio