 John E. Chapman Chief Executive Officer
This Market Correction May Not Be Over
Last week, I shared with you my view that investors overreacted to the tariff story and offered four scenarios whereby the markets could potentially stabilize and even bounce off recent lows. The very next day, President Trump announced a 90-day pause on tariffs for those countries that have reached out to the White House requesting the opportunity to negotiate individual trade agreements.
The announcement was effectively an “enhanced” version of the first of my four scenarios, and U.S. stocks (S&P 500) surged by 9.5%, marking their third-largest single-day gain since World War II. The Dow Jones Industrial Average rose by nearly 3,000 points (7.9%), achieving its most significant percentage increase since March 2020. The Nasdaq Composite jumped 12.2%, its second-largest single-day gain ever, surpassed only by a rally in January 2001.
Remarkably, approximately 30 billion shares were traded during the session, the highest volume recorded in 18 years. All this simply underscores how sudden policy shifts can dramatically influence investor sentiment and market performance.
How to Think About Large Snapback Rallies
Large counter-trend rallies are a common feature of market corrections. Historically, these rallies can last from a few days to several months. Unfortunately, these rallies are often temporary recoveries in stock prices that occur within a broader downtrend. All three of the major U.S. stock indices touched bear market levels, having declined by more than 20% from recent record highs. Every bear market between 1901 and 2015 experienced at least one rally of 5% or more, with two-thirds of those bear markets seeing rallies of 10% or greater.
Traditionally, most counter-trend rallies eventually fail with a retest or breach of prior lows. In fact, in 100% of cases studied involving sharp declines, the initial low was retested, and in most instances, new lower lows were reached (Source: Knowledge Leaders Capital).
So, how do investors know when to trust a countertrend rally that will carry markets back into a bull market phase? Of course, there are no definitive “markers” that identify a sustainable rally until after such a move has been made. Generally, we watch for validation of breakout rallies using traditional technical indicators. Such indicators include increasing volume on up days, a clear break above resistance levels, and observations relative to long-term moving averages. Ideally, positive technical developments would be accompanied by a tightening in bond yield spreads, stabilization in forward earnings expectations, and supportive policy announcements for the government.
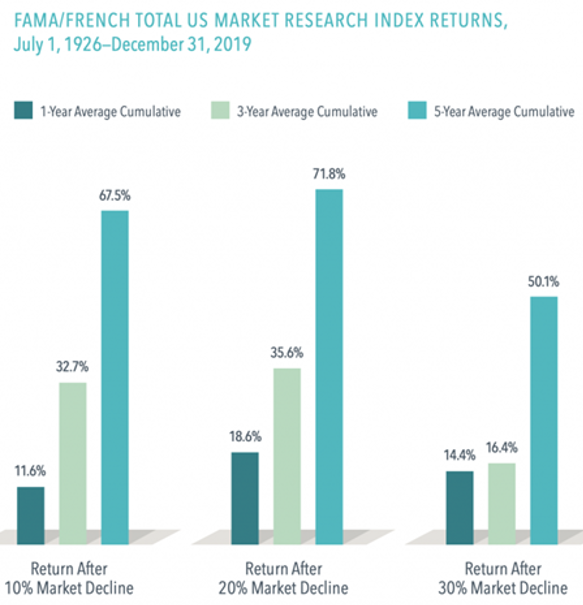
Typically, U.S. equity markets experience above-average total returns following periods of market stress – it just takes time. Forward returns in the first year following a 10% decline on average register at about +12%. Looking forward three years, history suggests returns of +30%. In fact, three-quarters of the 10% declines since 1975 have led to positive one-year returns, averaging 11%. Five-year returns after a 10%, 20%, and 30% decline historically compound to over 50%, aligning with the S&P 500’s long-term annualized average of ~9.6% (Source: The Planning Center).
Historic observations can be helpful relative to framing important questions surrounding retaining strategic legacy strategies and deploying new capital; however, it is important to further consider other current factors that have contributed to the recent spike in volatility. While the tariff headlines have dominated the news cycle, investors should be aware of the recent deterioration in consumer confidence, investor sentiment, and business owner expectations for the coming year.
Any slowdown in the pace of economic activity will impact earnings expectations on a forward basis. The consensus 2025 S&P 500 earnings estimate for 2025 currently stands at $268, and at $307 for 2026. I believe it is likely that these forecasts will be adjusted lower as we move through the first quarter earnings season in the coming weeks and corporate executives temper expectations relative to forward guidance. What is less clear at this time is the magnitude of this reset of expectations.
What Happens if a Recession Hits in 2025?
As previously noted, I believe the economy is showing signs of declining activity overall and remains at risk of a short and shallow recession. In his annual letter to shareholders, Jamie Dimon, CEO of JPMorgan Chase, highlighted broader economic risks associated with the tariff policies, including slowed growth, weakened investor confidence, and the possibility of a recession. This said, JPMorgan economists have raised the likelihood of a U.S. recession to 60%, citing the disruptive effects of the tariffs and trade disputes.
So, the question becomes, how have recessions historically impacted equity markets? On average, the U.S. stock market (measured by the S&P 500) tends to peak about six to eight months prior to the start of a recession. During this period, equity prices typically decline by approximately 30% from peak to trough in bear markets associated with recessions (Source: Research Affiliates). Equity markets have historically been mixed during recessions. For example, in 5 of the last 11 recessions since 1950, stock market returns were positive, indicating that not all recessions lead to major market corrections (Source: Fidelity). The average length of a recession is about 10-11 months.
Stock markets tend to recover strongly after the start of a recession. Historically, equities have gained an average of 10% three months after a recession begins, 15% after six months, and as much as 23-33% one to two years later.
The bottom line is that while the risk of a recession has been rising of late, moderate recessions do not uniformly lead to prolonged equity declines. While stocks may drop significantly before and during the early stages of a recession, historical data shows that markets often rebound well before economic conditions fully recover.
Conclusion
Equity prices were already elevated coming into the year and remain so. Continued stress related to a trade war and the potential for further escalation of tariff levels will put additional pressure on equity prices. Most of this story and the various consequences of these developments are still ahead of us. The main takeaway from this is that volatility may be with us for an extended period.
We will be watching the bond market, credit spreads, and the currency markets for additional clues about how this story plays out in the weeks and months ahead. We do not believe that this is a time for long-term investors to rethink strategy significantly, or for investors with high unallocated cash levels to rush in with the early countertrend rallies. Rather, we’d prefer patience in both regards. Rest assured, this will all be sorted out eventually, and a new period of prosperity will be ushered in.
Thank you for your continued confidence in Clearwater Capital. Please do not hesitate to reach out should you have any questions or concerns.
PS: We invite you to our upcoming in-person Market and Economic Update Symposium, where we’ll share timely insights and our outlook on what’s ahead. We hope you’ll join us for this exclusive engagement.
20250415 – 2